MISUMI's e-Commerce Site
We supply custom parts for automation devices and equipment, dies/molds, tools, consumables, and more, with same-day shipping at the earliest. Products from more than 3,000 domestic and international third-party brands, including MISUMI, are offered.
MISUMI's Digital Machine Parts Procurement Service
MISUMI's Digital Machine Parts Procurement Service
CAD-Integrated Software
CAD-Integrated Software

Instant quote via 3D data upload, with the fastest delivery in as little as one day
Software that allows you to design enclosures with the feel of a drawing
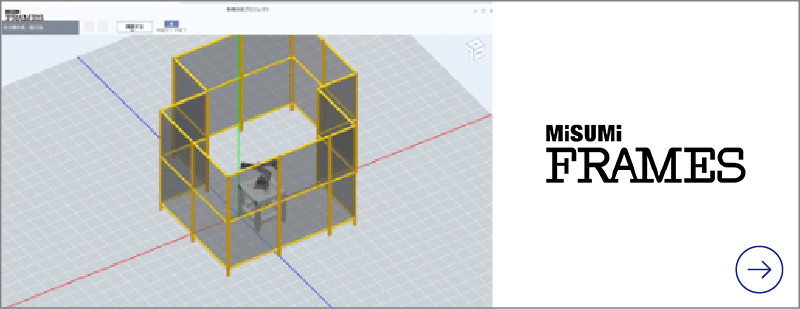
Data library for FA designers
DX Enables Smart Procurement
DX Enables Smart Procurement
Indirect material total cost reduction service
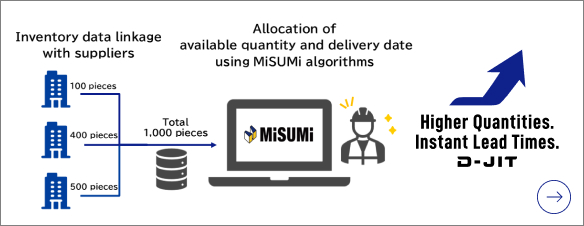
Instant quotes even for larger quantities ! A seamless ordering experience with no waiting for delivery estimates.